Diversity among our people in CLAS
Thursday, November 10, 2022
Improving representation in CLAS is essential in our DEI efforts, and critical to fostering community as defined in our strategic plan.
The University of Iowa and College of Liberal Arts and Sciences continue to be predominantly white, as noted in the 2022 diversity breakdown among faculty, staff, and students on this page. These numbers have remained largely unchanged from 2021 to 2022.
While recruitment is important, so is retention. Progress has been made in the recruitment process through the standardized use of Path to Distinction, a program addressing implicit bias in hiring. However more can be done, especially on retention. With these challenges in mind, the CLAS DEI Committee is leading efforts to propose mentoring structures for the college, developing equity audit guidelines, and creating a diversity, equity, and inclusion toolkit for instructors. These initiatives aim to promote an inclusive community and build stronger infrastructure to support DEI efforts.
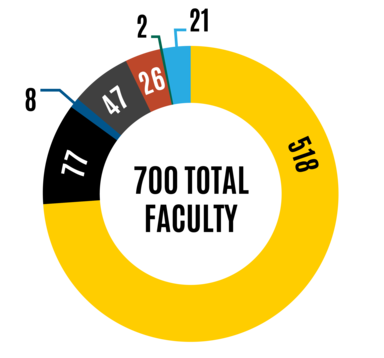
Faculty diversity| Race/ethnicity | Count | Percentage |
|---|
| White, not of Hispanic origin | 518 | 74.1% |
| Asian | 77 | 11% |
| Two or more races | 8 | 1.1% |
| Hispanic/Latinx | 47 | 6.8% |
| Black/African-American | 26 | 3.7% |
| American Indian or Alaskan Native | 26 | 3.7% |
| Not Specified | 21 | 3.0% |
| Total | 700 | 100% |
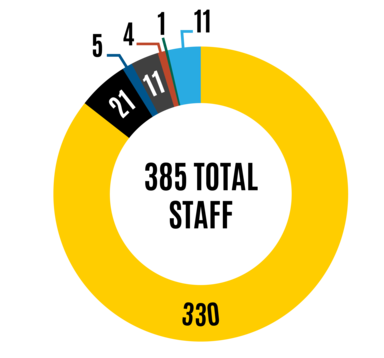
Staff diversity| Race/ethnicity | Count | Percentage |
|---|
| White, not of Hispanic origin | 330 | 85.7% |
| Asian | 21 | 5.5% |
| Two or more races | 5 | 1.3% |
| Hispanic/Latinx | 11 | 2.9% |
| Black/African-American | 4 | 1% |
| American Indian or Alaskan Native | 1 | 0.3% |
| Not Specified | 13 | 3.4% |
| Total | 385 | 100% |
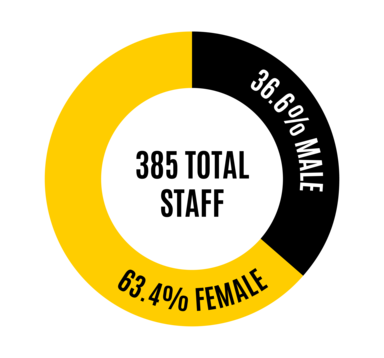
Staff Gender| Gender | Count | Percentage |
|---|
| Male | 141 | 36.6% |
| Female | 244 | 63.4% |
| Total | 385 | 100% |
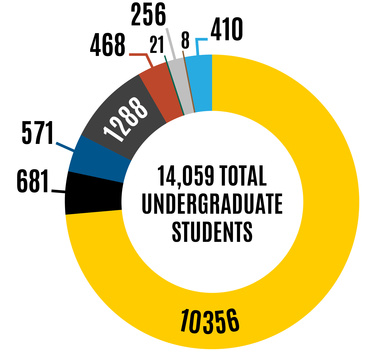
Undergraduate student diversity| Race/ethnicity | Count | Percentage |
|---|
| White, not of Hispanic origin | 10,356 | 73.7% |
| Asian | 681 | 4.8% |
| Two or more races | 571 | 4.1% |
| Hispanic/Latinx | 1,288 | 9.2% |
| Black/African-American | 468 | 3.3% |
| American Indian or Alaskan Native | 21 | 0.1% |
| International students | 256 | 1.8% |
| Native Hawaiian or other Pacific Islander | 8 | 0.1% |
| Not Specified | 410 | 2.9% |
| Total | 14,059 | 100% |
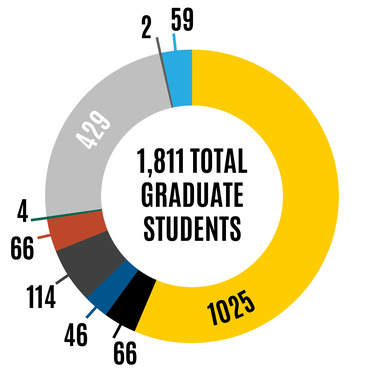
Graduate Student diversity| Race/ethnicity | Count | Percentage |
|---|
| White, not of Hispanic origin | 1,025 | 56.6% |
| Asian | 66 | 3.6% |
| Two or more races | 46 | 2.5% |
| Hispanic/Latinx | 114 | 6.3% |
| Black/African-American | 66 | 3.6% |
| American Indian or Alaskan Native | 4 | 0.2% |
| International students | 429 | 23.7% |
| Native Hawaiian or other Pacific Islander | 2 | 0.1% |
| Not Specified | 59 | 3.3% |
| Total | 1,811 | 100% |