College of Liberal Arts & Sciences
Explore Interactive Digital Projects from Intro to Geographic Visualization Students
May 20, 2020
Despite the challenges of finishing the semester remotely, students in Caglar Koylu's course Introduction to Geographic Visualization (GEOG: 3540) produced a varied series of interactive maps, graphics, and more for their final projects. Drawing on cartography, information visualization, and human-computer interaction, the course equips students with the knowledge and techniques to effectively produce their own visualizations from geographic data. Students also cover topics like animation, virtual and augmented reality, 3D modeling, and geovisual analytics. To learn more about the course learning outcomes and view projects from previous years, view the course website here.
The final projects were carried out in groups of 2-4 students and presented as an online project featuring interactive maps, analyses, and video discussions on the work. Groups were free to select topics based on their interests. Below is a selection of the projects from Spring 2020. Each project has a unique website where maps and data can be explored in greater detail.
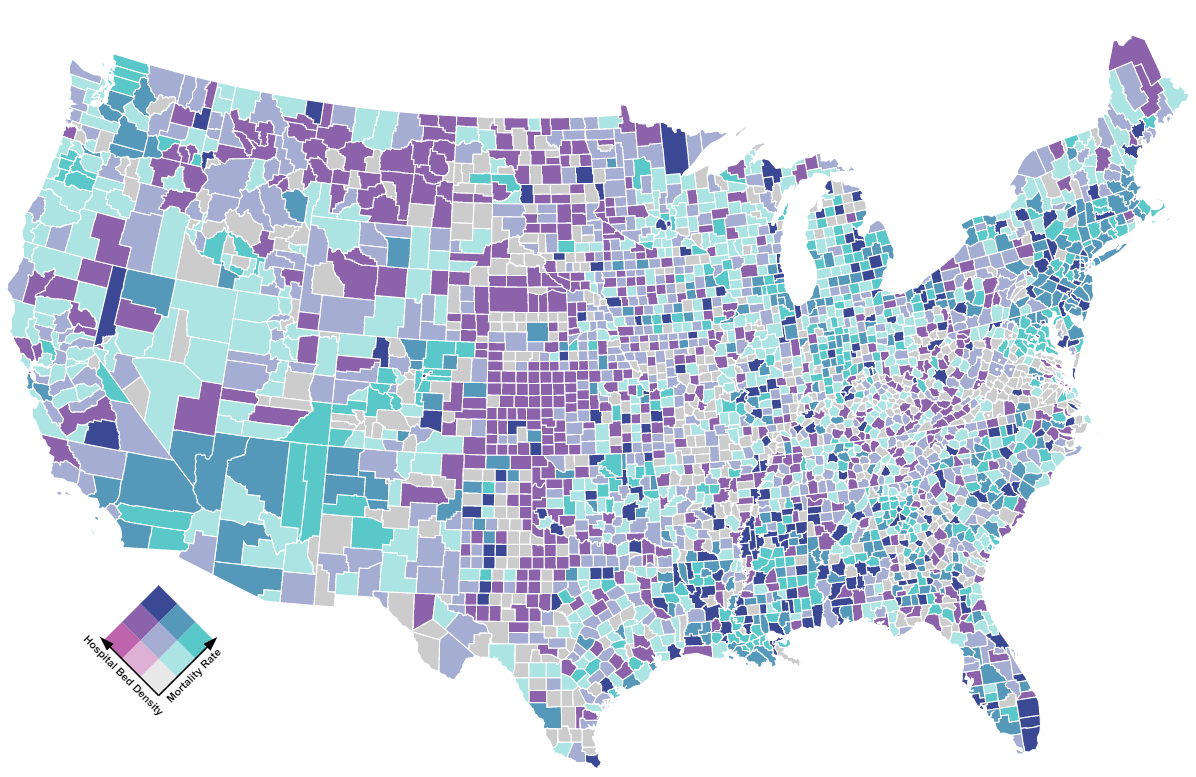
Mapping Vulnerability: The COVID-19 Pandemic
Jade Pederson, Emily Schmitt, Natalie Schoen, and Hailey Quinn
Current data shows that certain populations are disproportionately affected by COVID-19. Such populations include the elderly, ethnic minorities, individuals living in poverty, and people that suffer from chronic illnesses such as diabetes and lung disease. Our objective is to gain a better understanding of the presence of COVID-19 among different communities of people and to determine the factors that contribute to these trends. Additionally, we aim to understand how lack of resources such as hospital beds affect the number of COVID-19 cases in a given region.
Eric Baker and Mitchell Wisniewski
The goal of this project was to compare passport utility to political stability as a means of discovering meaningful global trends. Passport utility, which indicates the overall ability for citizens of a country to travel internationally, is measured through a mobility score and the Human Development Index (HDI) of a country. The analyses of this project could be used for multiple purposes and audiences. As the world grows more interconnected through technology and commerce, it is necessary to reflect upon the ability of humans to utilize transportation systems and travel internationally. International travel, which is heavily regulated by the abilities surrounding a given country’s passport, promotes cultural learning and understanding between nations. On one hand, policy analysts for a given country could utilize this project’s results to enhance their understanding of factors limiting their country’s global mobility. On the other hand, citizens of a country could consider this project’s results to help form and defend political opinions regarding foreign relations. In a broader sense, economists, geographers, scholars of migration can consider the results of this project when analyzing patterns of global processes.
Immigration in the United States
Claire Fienup and Angelina Evans
This project is designed to explore the patterns of immigration to the United States over the late 19th century and the 20th century. People from countries all around the world have been immigrating to the United States for centuries, bringing along their own language, food, art, traditions and more. The diversity in culture is what makes the nation as it is today.
People groups, the movement of those groups, culture, and language are some of the things we are interested in. We wanted to explore data that involve these things and show it to our viewers in a way that is easy to comprehend. Hopefully, you find the data as interesting as we do!
Both Sides of the Bottlecap: Drinking and Driving in Iowa
Julia Poska, Emily Manders, and Derek Tate
This project uses liquor sales, operating while intoxicated revocations, and alcohol-impaired driving deaths in Iowa to map and analyze the relationships between liquor sales and potential negative consequences from drinking alcohol. We hope you take away from this page how important it is to drink responsibly. While it can certainly be fun to visit your favorite liquor store and pick something to drink, it's no fun when you get your license taken away for driving under the influence, and even worse when your actions result in a person's death.
Percent Children Screened with Elevated Blood Lead Level in Chicago 1999-2013 by Community Area
Austin Tang
This map shows the lead poisoning situation in Chicago. As we see the overall situation becomes better, the areas with relatively high risk of lead poisoning stays the same. That reminds us no matter how glad we are to see the development of the whole society; we should never forget that disparity still exists.